|
|
|
Boundary County snowpack and precipitation
continue to look good this year |
|
March 8, 2016 |
 The
Boundary County area snowpack is looking more
and more optimistic at this point in the year.
The current snowpack is just shy being twice
what it was at this point last year, which was a
below average precipitation year, and a year
that was later stricken by wildfires throughout
the region, including some right here in our
county. The
Boundary County area snowpack is looking more
and more optimistic at this point in the year.
The current snowpack is just shy being twice
what it was at this point last year, which was a
below average precipitation year, and a year
that was later stricken by wildfires throughout
the region, including some right here in our
county.
Would you believe that as of yesterday, March 7,
there were 78 inches of snow on the ground at
the Hidden Lake monitoring station, which is at
an elevation of 5,040 feet in Boundary County's
Selkirk Mountains. And just last week, 85 inches
of snow were measured on the ground at the
station. (That's over 7 feet of snow on the
ground).
Those numbers are putting the Boundary County
mountain snowpack close to its 30 year average
for snowpack at this point in the year, good
news for a county that saw its snowpack level
off at about half its normal depth last year,
with no further appreciable gains after
mid-February.
Experts who monitor and study water, snow, and
precipitation patterns in our area make their
measurements on what they call the "Water Year."
The Water Year begins on October 1 of each
calendar year, and runs through until September
30 of the following calendar year. So, we are
currently in the sixth month (March) of the
current water year which began last October 1.
And at this point in the year, it's not looking
too bad.
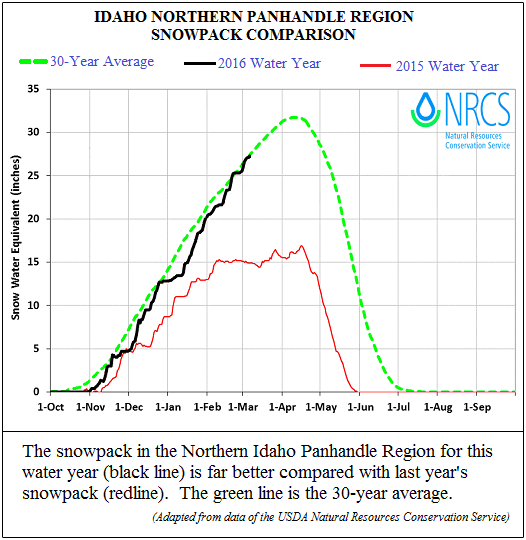
In the following chart, based on information
from the U.S. Department of Agriculture Natural
Resources Conservation Service, the green line
shows the 30 year average "snow water
equivalent" for the snowpack pattern seen in the
North Idaho Panhandle in a typical year. The
black line, representing this year's snowpack
information, is tracking along the 30-year
average pretty well. The chart's red line shows
how dramatically low last year's snowpack was,
dropping well below the 30-year average.
Boundary County has two monitoring stations that
each day measure precipitation, snowfall, snow
water equivalent, air temperature, and other
parameters. One site is in the Hidden Lake area,
at an elevation of 5,040 feet. The Hidden Lake
monitoring site was constructed in 2000, and
began operation in September 2000.
The second monitoring site in the county is in
the Myrtle Creek area, at a lower elevation of
3,520 feet, and began its monitoring operation
in October 2003.
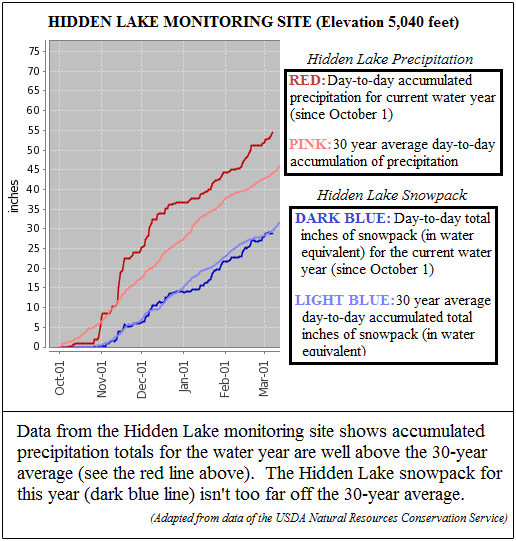
As of yesterday, March 7, the instruments at
Hidden Lake have measured a total accumulation
of 54.5 inches of precipitation since the water
year began last October 1. That amount is well
over the 44 inches usually seen by March 7,
according to the 30 year average. Hidden Lake's
54.5 inches are more than 120% of the 30 year
average.
At Myrtle Creek, again the numbers for total
precipitation look good so far. Total
precipitation at the Myrtle Creek monitoring
site since October 1 is 18.5 inches (as of
yesterday), which is 105% of the average amount
seen for March 7.
Now we're going to hold up for a moment while
you, our reader, take a moment to look through
the following two charts. The first chart shows
total precipitation and snowpack information for
the Hidden Lake monitoring site for the current
Water Year, and the second chart shows the same
information for the Myrtle Creek site:
(Story continues below these two
charts)
* * * *
* * * *
* * * *
* * * *
* *
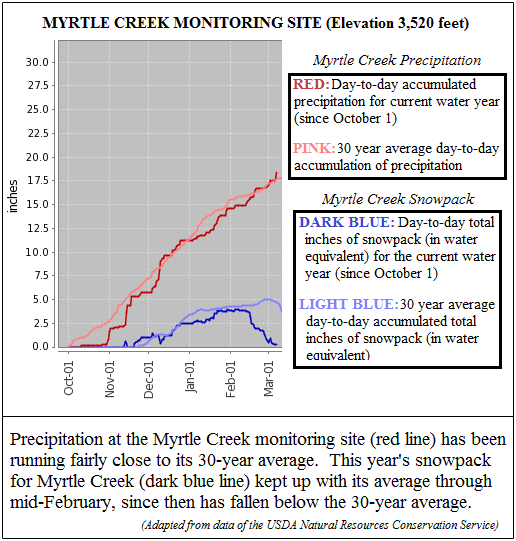
According to these charts, all the measured
precipitation and snowfall parameters are around
100% of average or better at the monitoring
sites, with the exception of the Myrtle Creek
snowpack, which was close to 100% of normal
until mid-February, but has dropped quite a bit
in the past two weeks.
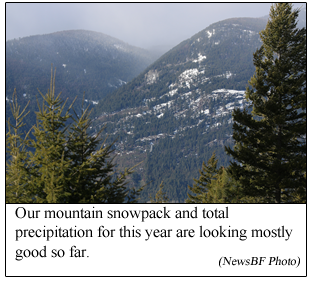
But overall, the snowpack and the precipitation
for the current water year are looking good for
Boundary County.
As can be seen in the top chart above (the Idaho
Northern Panhandle Region Snowpack Comparison
chart), according to the green line's 30-year
average, it is about mid-April when the snowpack
typically stops accumulating, and, as the green
line above shows, starts its downturn as spring
runoff begins. If our precipitation patterns can
just hang on and continue to accumulate for one
more month until the annual runoff begins in
mid-April, we should be in good shape.
Early on in the Water Year, experts were
concerned that a much stronger than usual El
Niño effect could cause havoc in mountain
snowfall and other precipitation water supplies
of the Pacific Northwest. Back in January, when
the situation looked a little more grim, and
concerns about El Niño were high , the National
Oceanic and Atmospheric Administration's Climate
Prediction Center in College Park, Maryland
issued a report stating that “El Nino has
already produced significant global impacts and
is expected to affect temperature and
precipitation patterns across the United States
during the upcoming months." The NOAA statement
continued with an unsettling scenario: “The
seasonal outlooks for January-March indicate an
increased likelihood of . . . below-median
precipitation over the northern tier of the
United States. Above-average temperatures are
favored in the West and Northern half of the
country."
The good news for now is that so far, those
concerns have not panned out, and precipitation
and snowpack in our area and in most of the
Northwest have held up.
Looking ahead to projected stream flows for the
coming spring and summer months, the Columbia
Basin Bulletin reported forecast information for
various Columbia River tributaries (of which the
Kootenai River is one) as follows: "As of March
2, water supply forecasts from April through
September are 97 percent of average for the
Columbia River at Mica Dam; 90 percent of
average for the Kootenai River below Montana’s
Libby Dam; 90 percent of average for the
Flathead River at Hungry Horse Dam; 94 percent
of average for the Spokane River; 101 percent of
average for the Columbia River at Grand Coulee
Dam; 94 percent of average on the Snake River at
Irwin; 83 percent of average for the Snake River
at American Falls; 99 percent of average for the
Snake River at Lower Granite Dam; and 96 percent
of average for the Clearwater River at Dworshak
Dam."
The Columbia Basin Bulletin goes on to say, "The
big bell weather for basin-wide streamflows is
on the Columbia River at The Dalles Dam —
currently projected to be at 100 percent of the
30-year average." |
|
|
|
Questions or comments about this
article?
Click here to e-mail! |
|
|
|
|